
ParaView is a widely used open-source post-processing tool. In the context of TRAFOLO, it is used to visualize results obtained from the electromagnetic and heat transfer simulations.
One of the key benefits is its ability to visualize complex, multi-dimensional datasets with many elements interactively and intuitively, analyze simulation results, and identify areas of interest for further investigation. In addition to its 3D graphics capabilities, ParaView also includes a range of tools for data manipulation. This consists of filtering and processing data, extracting features and surfaces, and performing statistical analysis. The software is also highly scalable, allowing users to process and visualize large datasets on multi-core computers.

Saving state file
Saving your custom results as a state file in ParaView is a convenient way to preserve your visualizations and make it easily accessible for future reference or sharing with colleagues. State files store the current result state, including filters, graphs, and custom visualization settings you have applied to your data. To save the state file in ParaView, follow these steps:
- Open ParaView with your current result set.
- Apply any filters, graphs, or custom visualization settings as desired.
- Click the “File” menu in the ParaView window’s top-left corner.
- From the dropdown menu, select “Save State…”.
- Choose a destination folder and provide a name for the state file (with a “.pvsm” file extension).
- Click “Save” to store the state file.
- Your custom result state is now saved as a “.pvsm” file, and you can load it later for further analysis or sharing.
Loading state file
To load a previously saved state file in ParaView:
- Open ParaView.
- Click the “File” menu in the ParaView window’s top-left corner.
- From the dropdown menu, select “Load State…”.
- Navigate to the folder where you saved the state file, select the “.pvsm” file, and click “Open”.
- ParaView will load the custom result state with all filters, graphs, and visualization settings previously saved in the state file. This feature lets you quickly restore your work environment and continue your analysis or collaborate with others.
IMPORTANT: State files store absolute paths to the result folder of the visualized case. Moving results or renaming will cause an error.
Using Filters
ParaView filters help extract specific information and visualize various properties of your simulation results.
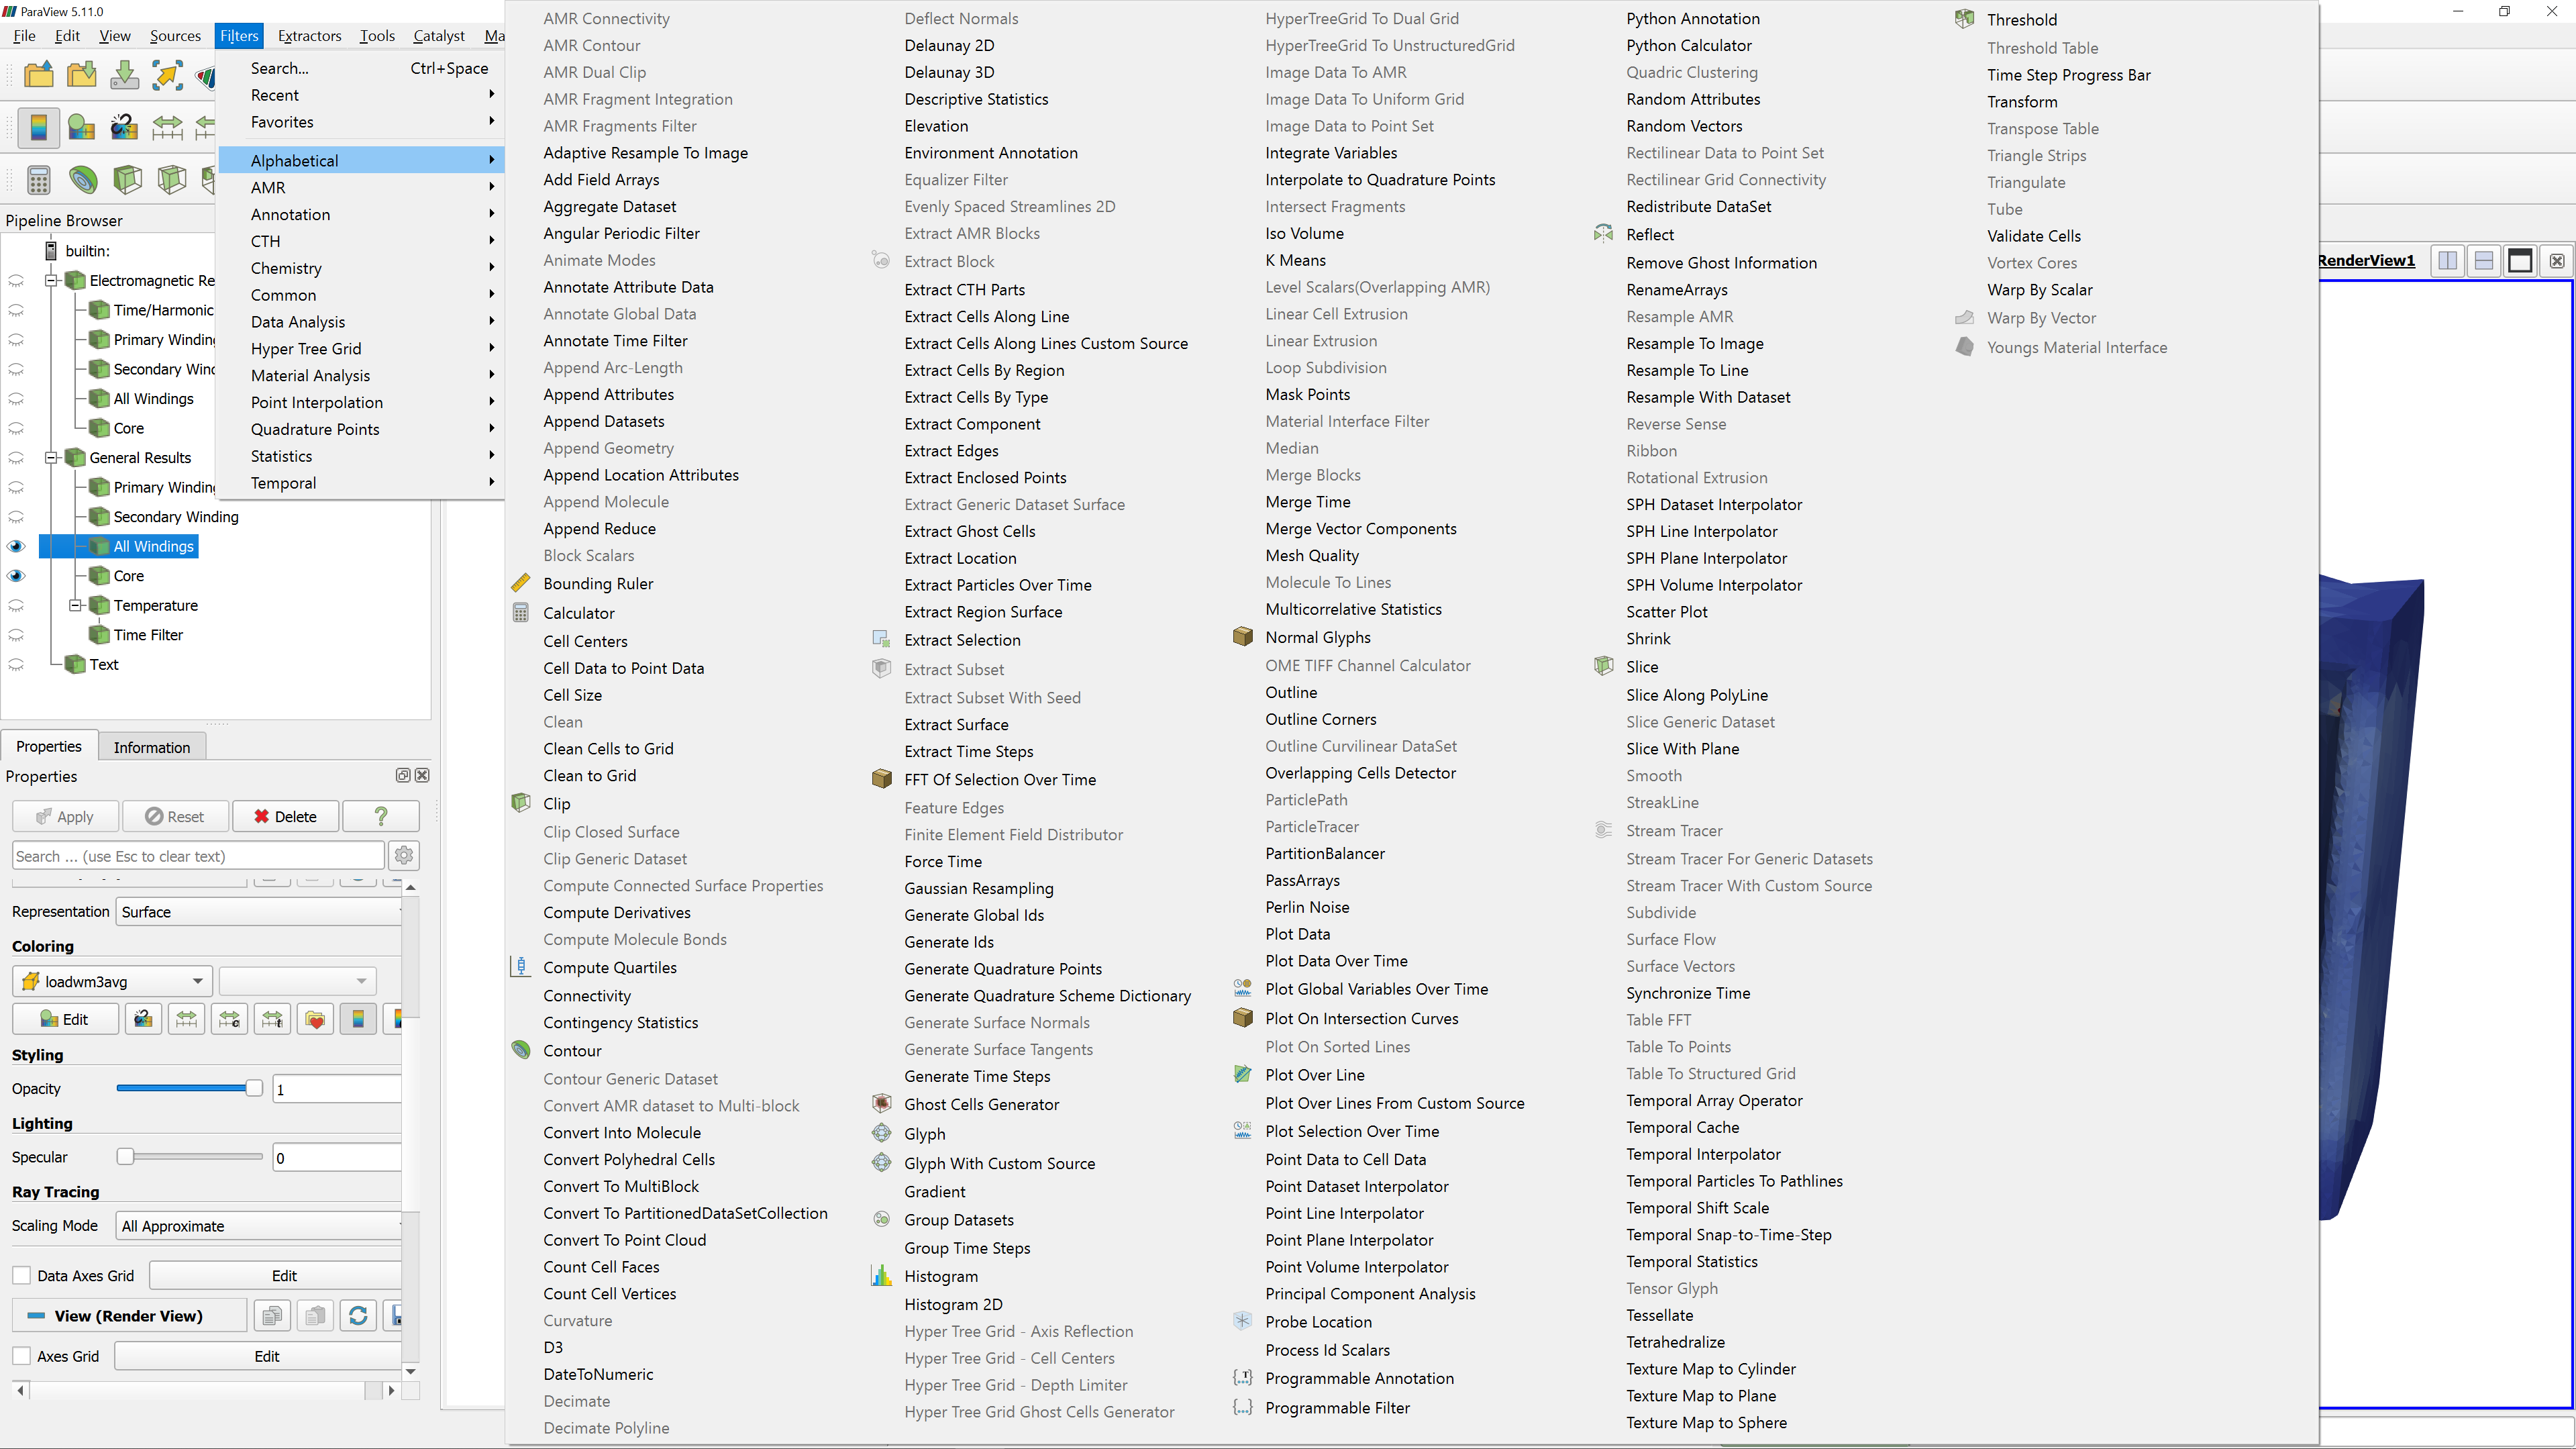
To access and use filters in ParaView, follow these steps:
- Open ParaView and load your simulation result data.
- In the Pipeline Browser on the left side, select the dataset to which you want to apply the filter by clicking on its name (e.g., Workpiece, Inductor, etc.).
- To find a specific filter, click “Filters” in the menu bar, then select “Search…”. Type the name of the filter you are looking for in the Search window and press Enter. All filters containing the entered keyword will be displayed and available for selection.
- If you are unsure which filter to use, click “Filters” in the menu bar and select “Alphabetical”. This will display an alphabetically sorted list of all available filters. Browse through the list and choose the one that best suits your needs.
- Once you have selected a filter, it will be applied to the dataset you previously chose in the Pipeline Browser. You can adjust the filter settings in the Properties panel on the left side of the ParaView window.
- To visualize the applied filter’s results, click “Apply” in the Properties panel.
- If you want to apply multiple filters, repeat steps 2-6 for each additional filter.
Always select the appropriate dataset in the Pipeline Browser before applying a filter. This ensures the filter is applied to the correct dataset and yields the desired visualization. Experiment with different filters to better understand and analyze your simulation data in ParaView.
Most used filters
Here’s a summary of the most commonly used filters in ParaView:
- Threshold: This filter extracts single or multiple domains from the entire dataset and allows you to manipulate results in these domains independently. It helps visualize specific regions of interest, such as windings or coils.
- Slice: The Slice filter cuts the domain with a plane, letting you visualize a domain layer. This is useful for examining cross-sections of your dataset at different locations.
- Clip: Similar to Slice, the Clip filter cuts the domain in half and lets you visualize only a part of it. This is helpful when focusing on a specific region within your dataset.
- Stream Tracer: The Stream Tracer filter generates streamlines for vector fields, making it helpful in visualizing magnetic field lines or flow paths in fluid simulations. It can help you understand the behavior of vector fields within your dataset.
- Plot Over Line: This filter plots results along a line drawn across the computational domain. It helps analyze how variables change along a specific path or compare values at various locations in the dataset.
These filters are essential for post-processing and result evaluation in ParaView. Experiment with them to better understand and analyze your simulation data, and remember to adjust the filter properties to customize the visualizations to your needs.